
 English


Views: 0 Author: Site Editor Publish Time: 2026-09-27 Origin: Site


A typical residential photovoltaic system in the United States costs between $22,240 and $23,600 for an 8 kWdc setup, according to the U.S. Department of Energy's 2025Q1 benchmarks. Adding battery storage pushes that figure to $34,640 or more. You reach your payback period when cumulative savings finally match your upfront cost. Most homeowners see break-even in 5 to 10 years. A full cost benefit analysis of solar panels depends on your location, system size, available incentives, and financing choices. The cost benefit analysis of solar also weighs rising electricity rates against your initial investment. Understanding your potential roi helps you judge whether panels make financial sense for your home.
Most homeowners break even in 5 to 10 years, then enjoy free power for decades.
Divide net system cost by annual savings to find your payback period.
Your location, local electricity rates, and incentives strongly affect your solar returns.
Ongoing maintenance costs and inverter replacement impact your long-term savings.
Solar panels can increase your home's resale value by about $15,000.
You pay for more than panels when you go solar. A photovoltaic system bundles several components into one installed price. Equipment covers the modules, inverters, and mounting hardware. Labor, permits, and inspection make up the rest. The table below shows how each category typically splits your total solar project cost.
Cost Category | Typical Percentage of Total Cost |
|---|---|
Solar Panels | 20% - 25% |
Inverter & Storage | 10% - 20% |
Balance of System (BOS) | 10% - 15% |
Labor & Installation | 10% - 15% |
Soft Costs (Permits, Design, etc.) | 25% - 35% |
Soft costs surprise many buyers. Permits, design work, and paperwork often eat up a quarter to a third of your budget. Equipment prices vary by tier as well. Budget modules run $0.25 to $0.40 per watt, while ultra-premium panels reach $0.95 to $1.20 per watt. In a typical $3.00 per watt system, modules account for $0.45 to $0.60 per watt, inverters add $0.30 to $0.45 per watt, and racking contributes $0.15 to $0.24 per watt. Your net upfront project cost depends on these choices. A standard 6 kW system lands near $18,000 before incentives, while a typical 5 kW setup ranges from $12,500 to $25,000. These figures shape your solar panel cost picture before any tax credit or rebate applies.
Ownership does not end at installation. You face recurring costs that affect your long-term roi. Annual servicing runs $100 to $150, and panel cleaning adds $100 to $250 each year. Insurance costs another $60 to $100 annually. Over 25 years, servicing totals $2,500 to $3,750, cleaning reaches $2,500 to $6,250, and insurance adds $1,500 to $2,500. Inverter replacement is the big one-time hit. You will likely replace it once during the system's life at a cost of $730 to $1,460. Total maintenance across 25 years lands between $6,500 and $11,250. These ongoing solar system costs matter for any honest cost benefit analysis of solar panels. Life cycle cost analysis is the tool that captures everything. It sums your installation costs, maintenance, insurance, and replacement parts over the full system life. That total gives you a truer picture than the sticker price alone. A complete cost benefit analysis of solar should always include these future expenses. Skipping them inflates your expected returns and hides the real pricing of ownership. When you compare quotes, ask each installer about monitoring fees and warranty terms. Those details protect your investment for decades.
You can measure your break-even point with one simple ratio. The simple payback period equals your net system cost divided by your annual savings. Net system cost means your total system cost minus any incentives, such as tax credits and rebates. Annual savings combine your yearly electricity bill reductions with the value of any excess energy you sell back to the grid. The table below breaks down each piece.
Component | Description | Example Value |
|---|---|---|
Payback Period Formula | Net System Cost / Annual Savings | 10 years |
Net System Cost | Total System Cost - Incentives | $18,000 (from $25,000 system minus $7,000 incentives) |
Annual Savings | Annual Electricity Bill Savings + Value of excess energy sold back to grid | $1,800 |
A quick example makes this concrete. Suppose your system costs $10,000 after incentives and saves you $1,500 each year. Your payback period is 6.7 years, because $10,000 divided by $1,500 per year equals 6.7 years. Start by finding your monthly savings, which is the avoided energy cost on your utility bill. Multiply that monthly figure by twelve to get your annual number. This first step anchors your entire solar payback period calculation.
Your annual savings depend on several moving parts. Each one shifts your roi in a different direction.
Energy consumption: Your yearly usage directly shapes your annual savings.
Electricity rates: Local prices affect your savings and payback period, and they vary by location and plan type.
Local climate: Regional sunlight levels affect panel efficiency and your overall payback period.
Incentives and rebates: Utility programs and local, state, and federal tax credits can significantly shorten your payback period.
Buyback plan: A buyback program pays you or credits you for excess energy you produce.
System efficiency: A more efficient photovoltaic system offsets a larger share of your consumption.
Customers who use more electricity can benefit the most from solar. Instead of paying the utility company each month, these homeowners are building equity through solar.
For a typical 6 kW system, you can expect about $1,500 in annual electricity cost savings. That figure gives you a solid starting point for your own math. Rising rates make the picture even better. Over the past 25 years, U.S. electricity rates have increased by an average of about 2.5% per year. Historical escalation runs near 3% per year, with a typical annual range of 2% to 4%. These increases compound your energy savings over time. A higher escalation rate shortens your payback period and lifts the net present value of your investment. This is why a full cost benefit analysis of solar panels should never treat today's rates as fixed. Your solar energy cost savings grow as utility prices climb, and that growth works in your favor year after year.
Your location shapes your solar panel cost more than almost any other factor. A home in Arizona with 7 peak sunlight hours needs fewer panels than an identical home in Washington with only 4 peak sun hours. The table below shows how peak sun hours vary across regions.
Region | Average Peak Sun Hours per Day |
|---|---|
Continental U.S. (most areas) | 4.0 – 4.5 |
Desert Southwest (Arizona, New Mexico, Nevada) | Over 6.0 |
Pacific Northwest & Alaska | ~3.5 |
A system rated at 10 kWh may realistically produce only 8 to 8.5 kWh on a Phoenix summer afternoon. This is physics, not a defect. System size also drives your solar panel cost. Larger systems cost more overall, but the price per watt often drops as soft costs spread across more watts. A complete solar panel cost analysis must weigh these variables together.
The federal solar investment tax credit (ITC) for 2024 is 30% of total system cost for both residential and commercial installations. This rate holds through 2032, then drops to 26% in 2033 and 22% in 2034. Many states add their own programs. New York's NY-Sun offers direct incentives up to $5,000 for residential installations. Oregon's Solar + Storage Rebate provides up to $5,000 residential and $30,000 commercial. Rhode Island's Renewable Energy Fund covers up to 30% of project costs. These programs lower your installation costs and shorten your payback period.
Your solar financing options include cash purchase, loans, leases, and power purchase agreements. Cash delivers the best roi but demands the highest upfront payment. Loans spread your installation costs over time. Leases and PPAs let you avoid upfront costs while someone else owns the system.
Electricity cost escalation rates matter too. Over the past 25 years, U.S. electricity rates have risen about 2.5% per year. Higher escalation shortens your payback period and raises net present value. Your solar energy cost savings grow as utility prices climb, which strengthens the cost benefit analysis of solar panels.
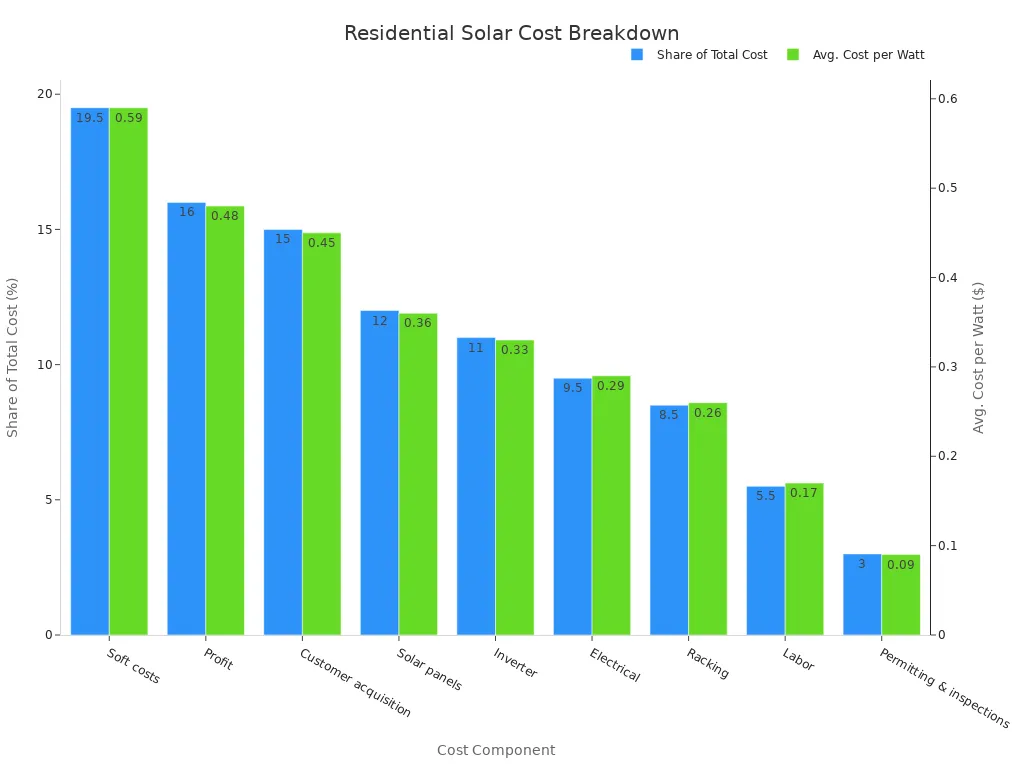
Image Source: unsplash
Your home system and a business system follow different financial rules. A residential installation typically runs 6 to 10 kW with an average cost near $24,160. Your payback period lands between 7 and 12 years. Commercial systems operate at larger scale. A typical business installation reaches about 99.36 kW and costs roughly $234,512. The payback averages about 10.48 years though the range stretches from 3 to 10 years depending on energy use and local incentives. No single average payback exists for commercial solar because each business has unique load profiles and tax situations. Commercial solar project economics accounts for these variables. A thorough commercial solar panel cost breakdown shows that scale changes the math. Lifetime return differs dramatically too. Home systems deliver 200 to 400 percent roi over their lifespan. Business systems can return 1,200 to 1,500 percent because they offset more energy at higher volumes. When you examine commercial solar economics, the larger investment produces stronger returns per dollar. Analysts cite the cost effectiveness of solar energy for commercial buildings as a strong argument for business adoption.
Your financing choice shapes your returns. Cash purchase delivers the highest 25-year total return. You own every kilowatt-hour. Your payback formula is system cost minus tax credits divided by annual electricity savings.
A solar loan lets you own the system with lower upfront money. Watch for hidden dealer fees:
The Consumer Financial Protection Bureau (CFPB) reports that lenders add fees increasing loan principal by 10-30% above the cash price. A $30,000 cash system might become a $36,000 loan.
The median quoted solar loan APR in late 2025 was 7.5 percent. Dealer fees of 20 to 35 percent raise your effective cost.
A lease or power purchase agreement offers zero upfront cost. You pay a monthly rate. A PPA with a 2.9 percent annual escalator starting at $0.14 per kilowatt-hour reaches $0.25 by year 20. That rate can erase savings. A PPA saves $720 in year one and $18,400 over 20 years. A purchase after the tax credit saves $1,650 in year one and $38,000 over 20 years. The purchase pulls ahead by year seven. A cost benefit analysis of solar panels should compare these paths. For businesses, understanding solar energy cost savings for businesses requires a similar comparison. A complete cost benefit analysis of solar must weigh upfront costs against long-term gains.
A worked example makes the math real. Picture a 6 kW residential system in a moderate-sunlight state. Your installed cost before incentives runs $18,000. The 30% federal tax credit cuts that to roughly $12,600. Your panels produce enough power to save $1,500 in the first year. You assume utility rates climb 3% annually, matching the historical U.S. average.
Input | Value |
|---|---|
System size | 6 kW |
Installed cost | $18,000 |
Net cost after 30% ITC | $12,600 |
Year-one energy savings | $1,500 |
Annual rate escalation | 3% |
These five numbers drive your entire solar panel cost benefit analysis. Change any one of them and your result shifts.
Divide your net cost by your first-year savings. You get 8.4 years, because $12,600 divided by $1,500 equals 8.4. That figure sits inside the attractive 5-to-10-year benchmark. Add rate escalation and the picture improves. Your cumulative savings cross the net cost line sooner than the simple formula suggests, because each year's avoided cost grows.
Now compare two contrasting cases. A 6 kW system in Trinidad and Tobago shows a 29.05-year payback period. High upfront costs and low local electricity rates explain that gap. Norway tells a different story. Its greenhouse gas payback runs 3 to 8 years, though that metric measures emissions, not dollars. Both cases prove one point: your solar panel cost and payback period depend heavily on where you live.
Your roi also depends on what you compare. A cash buyer in our example sees strong returns. A lease customer with an escalating payment may see weaker ones. Run your own numbers before you sign. A careful cost benefit analysis of solar panels protects you from surprises. The same discipline applies to any cost benefit analysis of solar project, large or small.
Your solar investment rewards you in several ways at once. The most direct gain comes from lower monthly electricity bills. Homeowners typically save $1,200 to $4,000 or more annually after installing panels. Over the full system lifespan of 25 to 30 years, those numbers accumulate significantly. EnergySage reports average lifetime savings between $10,000 and $30,000 for U.S. homeowners. A typical household using 10,000 kWh per year pays about $1,331 annually at average rates. Covering your full energy need with solar yields more than $33,000 in cumulative savings over 25 years. That figure excludes future rate increases.
Property value rises too. Lawrence Berkeley National Laboratory found that homes with solar sell for roughly $15,000 more than comparable homes without it. Zillow's 2019 analysis showed a 4.1% premium. SolarReviews in 2024 found a 6.8% increase with a median margin just over $25,000. On a $375,000 home, a 4% premium adds about $15,000 in value. Solar-powered homes also tend to sell faster than conventional properties.
Environmental benefits accompany the financial ones. On-site generation with battery storage reduces your reliance on grid power. Your property becomes an eco-friendly investment that integrates with EV chargers and smart home controls. This combination strengthens your cost benefit analysis of solar panels.
Your solar financial business case depends on several conditions aligning. A typical payback period runs 4 to 12 years, with break-even at 10 years or less. Your system then produces free power for another 15 to 20 years. Your cost benefit analysis of solar panels becomes more favorable in regions with high utility rates.
Location, electricity rates, and incentives shape your return on investment. A region with high utility costs and strong sunlight delivers faster roi. The federal tax credit and state rebates lower your upfront solar panel cost. Your energy savings grow each year as utility rates climb. This improves your solar energy cost savings over time. High rate escalation further improves your roi.
Maintenance also matters for your payback period and cost-benefit analysis. Higher expenses extend your break-even point. When you run a proper solar panel cost benefit analysis, include every cost over the system's life. A complete cost benefit analysis of solar also weighs environmental gains. A thorough cost benefit analysis of solar considers all these variables together.
Your solar energy cost benefit analysis shows the strongest case in areas with expensive electricity. A full solar panels cost benefit analysis should compare local quotes. Net your incentives and calculate your actual break-even year. That discipline turns a purchase from a guess into a sound investment.
A photovoltaic system pays you back twice. You cut monthly bills through energy savings, and your property value climbs. Research from Lawrence Berkeley National Laboratory shows solar homes sell for about $15,000 more. Your payback period often lands between 5 and 10 years, far shorter than the 25-to-30-year system lifespan. That gap gives you decades of essentially free power.
Run a cost benefit analysis of solar panels with your own numbers. Gather local quotes, check every incentive, and calculate your break-even year. A careful cost benefit analysis of solar protects your roi. Your situation is unique, so consult a solar professional today and turn sunlight into a sound investment.
Most homeowners reach break-even in 5 to 10 years. Your exact number depends on system size, local electricity rates, and available incentives. A $10,000 net cost with $1,500 in yearly savings pays back in 6.7 years. Your panels then produce free power for another 15 to 20 years.
Divide your net system cost by your first-year savings. Net cost means total cost minus incentives. Start with your monthly avoided energy cost, then multiply by twelve. A $12,600 net cost and $1,500 in annual savings gives you 8.4 years. Rising utility rates shorten that timeline.
Location and sunlight hours top the list. Local electricity rates, system size, and incentives follow close behind. The 30% federal tax credit lowers your upfront cost. Utility rates climb about 2.5% per year on average. That escalation lifts your long-term returns. Maintenance costs also matter.
Yes, though the math tightens. You lose 30% of your upfront savings. Your payback period stretches, and your returns shrink. State programs like NY-Sun and Oregon's rebate can fill part of that gap. Run a solar panel cost benefit analysis with your local numbers before you decide.
Solar homes sell for roughly $15,000 more than comparable homes without panels. SolarReviews found a 6.8% premium in 2024. Your home may also sell faster. These gains add to your bill savings. Together they strengthen any cost benefit analysis of solar panels.
A lease or PPA removes your upfront cost. You pay a monthly rate instead. Watch the escalator clause. A 2.9% annual escalator can push your rate from $0.14 to $0.25 per kilowatt-hour by year 20. A purchase usually pulls ahead by year seven. Compare both paths carefully.